


Guests
- Jamon Van Den Hoekassociate professor of geography at Oregon State University and the lead of the Conflict Ecology lab.
- Corey Scherdoctoral researcher at the CUNY Graduate Center in New York.
Democracy Now! speaks with two researchers who lead the Decentralized Damage Mapping Group, a network of scientists using remote sensing to analyze and map the damage and destruction in the Gaza Strip since Israel’s attacks began on October 7. Radar technology shows that Israel’s bombing campaign has left about half of all buildings in northern Gaza damaged or destroyed since October 7, with at least 56,000 buildings in Gaza damaged overall. Doctoral researcher Corey Scher explains how researchers use open data to bring consistent, transparent assessments of the rapidly expanding damage in Gaza. “We’ve all been surprised at the speed of this,” says Jamon Van Den Hoek, lead of the Conflict Ecology lab.
Related Story
Transcript
AMY GOODMAN: This is Democracy Now!, democracynow.org, The War and Peace Report. I’m Amy Goodman, with Juan González.
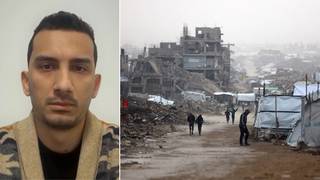
We end today’s show looking at how Israel’s 47-day bombardment has left Gaza in ruins. Satellite images show the Israeli attacks have left about half of all buildings in northern Gaza damaged or destroyed since October 7th. Overall, researchers say at least 56,000 buildings in Gaza have been damaged.
We’re joined now by two researchers who lead the Decentralized Damage Mapping Group, a network of satellite image scientists using remote sensing to analyze and map the damage and destruction in the Gaza Strip. Corey Scher is a doctoral researcher at CUNY, the CUNY Graduate Center here in New York, and Jamon Van Den Hoek is an associate professor of geography at Oregon State University, the lead of the Conflict Ecology group.
Jamon, let’s begin with you. Explain what you found in these charts, these images that you have of Gaza, where it stands today, where it stood a month ago.
JAMON VAN DEN HOEK: Yeah. Thank you, Amy, for the invitation to speak with you today.
We’ve been charting damage using satellite radar technology since the start of the war across the entire Gaza Strip every five to six days. So we update our damage maps, we share them with journalists and humanitarian actors every five or six days, and we track what we identify as likely damage across the Gaza Strip.
What we’ve seen is a really steady and fast expansion of damage across especially northern Gaza. As you mentioned, North Gaza governorate and Gaza governorate, just last week, leading up to Saturday, we’re approaching 50% of buildings seeing likely damage. Now, there’s still much less damage in southern Gaza. Rafah, for example, is maybe somewhere between 5 and 8%. But as your earlier guests were saying, we’re expecting that to increase as the war continues.
JUAN GONZÁLEZ: And have you ever seen this scale of damage and destruction at such a rapid pace in any conflict in other parts of the world?
JAMON VAN DEN HOEK: It’s difficult to say. We haven’t yet used the same approach to measure, say, the rate of damage across Ukrainian cities or Syrian cities or Yemeni cities. But I think we’ve all been surprised at the speed of this. And part of that is just how compact Gaza is. If you look at the rate of progress of damage on our maps, it’s just filling up the map of Gaza, especially in the north. And that’s been consistently surprising to us.
JUAN GONZÁLEZ: I’d like to bring Corey Scher into the conversation. Corey, how does open access to these satellite images help understand and compare the impact of conflicts?
COREY SCHER: Thanks, Juan, for the question.
Open data helps us to maintain a consistent delivery of damage assessments. Whereas it’s been a big issue for journalists and humanitarian organizations acquiring very high-resolution satellite data from private companies, we don’t face those issues, because our work focuses on leveraging science and open data to make sure that we can provide a consistency and quality of this type of assessment across the duration of, for example, what’s going on in Gaza. Open data is a cornerstone of the work that we do, because it helps us bring transparency to this in a way that can’t be interrupted.
AMY GOODMAN: I wanted to ask you about how rare your work is, which may surprise some people, not reliant on commercial imagery. Semafor recently reported earlier this month that key providers of satellite photographs to news organizations and other researchers had begun to restrict imagery of Gaza after a New York Times report on Israeli tank positions based on the images. Can you talk about this? In the early days of Russia’s invasion of Ukraine, commercial satellite companies provided some of the most compelling images and insights into how the conflict was developing on the ground. And, of course, this has changed after Israel’s attacks and invasion of Gaza, Corey.
COREY SCHER: Thanks, Amy. Well, I can’t really comment on the politics or the policy of a specific company. All I can say is that leveraging open data, that we use, can guarantee that regardless of what’s happening in the private sector, open Earth Observation has the potential to at least give some type of insight into the impacts of conflict happening on the ground. So, I think that’s all we can really say.
JUAN GONZÁLEZ: And could you talk a little bit more about what the difference is between commercial images and the ones that you use?
COREY SCHER: Yeah. Thanks, Juan. So, what we’re doing is a scientific analysis of satellite radar data. So, I want you to imagine a camera flash, that you’re one of the — take a picture of something at nighttime. The camera flash leaves the camera, goes through space, bounces off the surfaces. Say you want to take a photo of me. So, the camera flash goes off my face and then illuminates my face, goes back to the sensor, and then you have recorded an image.
So, now we’re going 700 kilometers in altitude. There’s satellite radar. Similar to a camera flash, a burst of microwaves, radar waves, go down to the Earth. They illuminate a region, and then the echoes of these waves scatter back to the sensor, and we can make an image — the sensors make an image, regardless of day or night or cloud cover conditions. So this adds to the level of consistency where we can image a region. Every revisit of the satellite overpass, usually we have a good acquisition.
AMY GOODMAN: Ja—
COREY SCHER: Um —
AMY GOODMAN: Go ahead.
COREY SCHER: Yeah, thank you. Well, what we’re doing is listening for very small changes in these echoes. So, if you imagine walking into a room where there’s no furniture, you listen to the sound of your voice echoing throughout the room, remember that echo, go back later after installing a carpet or a bookshelf, and you can hear a slight change. Scientifically, our algorithms are looking for very small variations in the radar echoes that bounce off the Earth’s surface and go back to the satellite to map indicators of damage. So this is very much different than a picture, right? We’re not looking at pictures. We’re running satellite radar data through scientific algorithms we’ve spent years developing, ultimately to resolve these signals of damage.
AMY GOODMAN: Jamon Van Den Hoek, if you can explain how open access to these satellite images helps you understand and compare conflicts, like what you see in Gaza? And how are your images different from commercial imagery, and how you get it, and comparing Gaza, for example, to Mariupol in Ukraine?
JAMON VAN DEN HOEK: Sure. As Corey was saying, we’re sensitive to different kinds of things than one could see if you looked at basically a bird’s-eye view of Gaza. We are sensitive to lateral damage, so damage to the walls, to the sides of buildings, structures, that you can’t see if you just look top down. That’s a key difference just between optical overhead imagery and side-looking radar imagery. That’s a bit technical, but that’s an important difference when we have ground invasion. Not everything is aerial bombardment. Not everything has a roof being destroyed.
The other aspect that Corey was touching on, as well, is — and you mentioned with the Semafor article — are those restrictions, where commercial providers, over many years of developing relationships with humanitarian actors — there’s become a dependency on using commercial imagery in the humanitarian space, as well as in journalism, to monitor conflict effects on communities, landscapes, farms, forests. That’s developed a kind of relationship with these commercial providers such that that’s basically the literacy, is using those kind of very high-resolution images, the kind you might see at, say, a Google-based map or an Apple-based map in Apple Maps, very clear, high detail. You can make out features. However, those images are usually very small-scale. They’re narrow strips of land. They’re acquired in a sort of ad hoc and sometimes inconsistent manner. If there’s cloud cover, you can’t see through the clouds. Working over a country as large as Ukraine, for example, it’s incredibly difficult to get, wall to wall, the entirety of Ukraine covered with commercial imagery in that way, not just because of the size of Ukraine, but because of all the atmospheric and weather effects that happen that obscure your view.
Radar doesn’t have those kind of limitations. And working with civilian spacecrafts — we’re working with the European space agency Copernicus Programme’s Sentinel-1 satellite, which is an amazing satellite that’s been in operations for about eight years now — we don’t have those restrictions. So, we can, in a sense, just as easily detect conditions, damage, whether it’s cloudy, whether it’s day or night. It doesn’t matter to us. We don’t need visible light do this.
And we can also, because we have open access to it, and everyone does — you and Juan can go right now to Sentinel help and download your own satellite images and do this. Anyone has access to this. So there’s a tremendous opportunity for democratization and transparency of the methods. We aren’t hiding behind any sort of commercial barrier or some bespoke algorithm where the inner workings are unclear. We’re trying to be incredibly transparent and be very direct with the limitations of what this approach offers, and sharing this with actors, journalists, humanitarian organizations, who can do other things with it than we can. We can map likely damage. We can make estimates of damaged structures. We cannot do all these other amazing things that so many people are working on on the ground, as well as through sort of remote journalism practices. So, it’s become a really much — very much a team effort, where, yes, we’re doing this analysis in an open way, but then what we generate, we share, and then it goes — it’s gone off, and people have made amazing products that have really told a kind of a narrative that we’ve never been able to imagine, really.
AMY GOODMAN: Professor Van Den Hoek, have you been warned about what you’re doing? Have you been warned? I don’t hear you. Sorry. Go ahead.
JAMON VAN DEN HOEK: There’s nothing — no, we have not been warned. There’s nothing illegal about what we’re doing. We’re accessing open imagery. There’s no — we have not been communicated with anybody about anything of this nature.
JUAN GONZÁLEZ: And, Jamon, I’d like to ask you — you worked on a report with Amnesty International looking at the 2014 Israeli attacks on Gaza, and you also analyzed satellite imagery back then. How has the science evolved over the years?
JAMON VAN DEN HOEK: It’s like night and day. Back then, we were working with also open data, but a combination of commercial imagery. This system that we’re working with now didn’t exist at that time, this radar technology that we’re using today.
Working with Amnesty International — it was also led by Forensic Architecture — we were able to combine different kinds of satellite images to monitor very specific features. So, we were able to see, say, individual trees destroyed by tanks or trucks in Rafah. But it was very localized, and it was also — Protective Edge was such a short conflict, really, very, very brief. And so, there, we just looked at kind of before and after.
That kind of before-after approach doesn’t work with a conflict that’s now — a war that’s now gone on 47 days. We’re not interested in the after. We want to know the process. We want to know the pattern of change as it’s manifest on the ground. Those concerns weren’t really there for such a short conflict, but we also didn’t really have the means to do it. And now —
AMY GOODMAN: We just have 10 seconds.
JAMON VAN DEN HOEK: Thank you. Every five days, we can update this, and we just have a much better sense of grasping the dynamics of this war than, really, any other conflict that we’ve looked at.
AMY GOODMAN: Jamon Van Den Hoek, we want to thank you so much for being with us, and Corey Scher, part of the Decentralized Damage Mapping Group, a network of satellite image scientists using remote sensing to analyze and map the damage and destruction in the Gaza Strip.
That does it for our show. I’m Amy Goodman, with Juan González, for another edition of Democracy Now!

Media Options